
Understanding Market Liquidations: Liquidity Sweeps and Runs Explained

Ken Aguilar
JAN 30 2025
Last Updated: April 08, 2025
This article is reviewed annually to reflect the latest market regulations and trends
Have you ever wondered why markets suddenly reverse or continue trending after breaking support or resistance levels? Let’s uncover the mystery of liquidity sweeps and runs.
In this article, I will discuss two essential forms of market liquidations: liquidity sweeps and liquidity runs. These concepts are invaluable for traders and speculators seeking insights into probable price movements.
While there are other complex forms of market liquidity, this article focuses on these two, as they form the foundation for understanding broader market dynamics.
For beginners, the concepts may seem challenging. However, mastering them can significantly enhance your trading journey. I’ll provide chart examples and discuss trade strategies with risk-to-reward considerations to help you capitalize on these market phenomena.
The Role of Market Liquidations
Based on my observations and trading experience, market liquidations are often necessary for the market’s sustainability.
Contrary to the standard view of support and resistance levels as static barriers, liquidations test these levels’ strengths or weaknesses. This process fuels market activity, providing opportunities for traders to identify potential trends and reversals.
Market liquidations serve a dual purpose. They not only facilitate clearing imbalanced orders but also create opportunities for traders to analyze market sentiment.
By observing how prices react to liquidations, traders can gauge the strength of underlying trends. This insight can be a game-changer for those looking to stay ahead in the market.
What is a Liquidity Sweep?
A liquidity sweep occurs when the market moves to trigger stop-loss orders or entice breakout traders.
This action targets areas of high liquidity, such as above resistance or below support levels.
Key Characteristics:
- Indicates weakness in the opposing side of traders.
- Often precedes a reversal or new trend direction.
- Provides clues about market sentiment and positioning.
For example, imagine a resistance level where many traders place stop-loss orders.
A liquidity sweep might momentarily push prices above this level, only to reverse sharply, leaving breakout traders trapped. This phenomenon highlights the importance of patience and observation in trading.
What is a Liquidity Run?
A liquidity run, on the other hand, occurs when the market sustains momentum in a particular direction, consuming liquidity along the way. Unlike sweeps, runs signify strength in the prevailing trend.
Key Characteristics:
- Often aligns with the current trend.
- This can result in significant price continuation.
- Reflects strong participation from trend-following traders.
For instance, in an uptrend, a liquidity run might involve the market breaking through resistance levels repeatedly, with minimal retracements.
Traders who recognize these runs early can capitalise on extended price movements, maximizing their gains.
Liquidity Sweeps vs. Liquidity Runs
- Liquidity Sweep: Signals potential reversal or trend change.
- Liquidity Run: Indicates trend continuation.
- Timeframe Dependency:
- A weekly chart may show a liquidity sweep, while a 4-hour chart of the same asset displays a liquidity run.
Understanding the interplay between these two concepts is crucial for traders. It allows them to differentiate between false breakouts and genuine trend continuations, reducing the likelihood of costly mistakes.
How to Identify and Trade Liquidity Sweeps
- Look for Key Levels: Identify areas with significant stop-loss clusters or breakout traders’ interests.
- Wait for Confirmation: After a sweep, observe whether the market rejects the level strongly.
- Entry Strategy:
- Enter after a single retest of the swept level.
- Set a tight stop-loss just beyond the swept area.
- Risk-to-Reward Ratio: Aim for at least a 2:1 reward-to-risk ratio.
Additionally, use tools like volume profiles or order flow indicators to enhance your analysis.
These tools can help you confirm whether a liquidity sweep is likely to lead to a reversal.
How to Identify and Trade Liquidity Runs
- Identify the Trend: Use higher timeframes to confirm the prevailing trend.
- Spot Breakouts: Look for consistent breakouts with minimal retracements.
- Entry Strategy:
- Enter on pullbacks within the trend.
- Use moving averages or Fibonacci retracements as support/resistance guides.
- Risk-to-Reward Ratio: Target a 3:1 or higher reward-to-risk ratio.
Traders should also pay attention to market sentiment during liquidity runs. Positive news or strong economic data can often fuel these runs, providing additional confirmation for your trades.
The Complexity of Liquidity Sweeps and Runs
Liquidity sweeps and runs vary across timeframes. For example, while a weekly chart might show a liquidity sweep, a 4-hour chart could display a liquidity run within the same price movement.
This disparity highlights the importance of multi-timeframe analysis.
Multi-Timeframe Analysis Tips:
- Use higher timeframes to identify major trends and liquidity zones.
- Tune your entry and exit points with greater precision by focusing on shorter time frames.
- Look for alignment between timeframes to increase trade confidence.
By mastering multi-timeframe analysis, traders can gain a more comprehensive view of the market, enabling them to make informed decisions.
Common Mistakes to Avoid
- Overleveraging: Always manage your risk and avoid excessive position sizes.
- Ignoring Confirmation: Entering trades without waiting for confirmation can lead to losses.
- Neglecting Timeframes: Focusing on a single timeframe can result in missed opportunities or misinterpretations.
- Emotional Trading: Allowing fear or greed to dictate your decisions can undermine your strategy.
Avoiding these pitfalls requires discipline and a commitment to continuous learning. Keeping a trading journal can also help you identify and correct recurring mistakes.
Chart Examples and Trade Setups
Let’s consider a hypothetical scenario:
- Setup: A key resistance level on a currency pair’s daily chart.
- Liquidity Sweep: Price briefly breaks above resistance, triggering stop-loss orders.
- Confirmation: Price quickly reverses, forming a bearish engulfing candle.
- Trade Execution: Enter short on the retest of resistance, with a stop-loss above the sweep high.
- Outcome: Price moves significantly lower, yielding a 3:1 reward-to-risk ratio.
This case study illustrates the importance of patience and precision in trading. By waiting for confirmation, traders can avoid false signals and improve their success rate.
Let’s take the XRP charts below as an example.
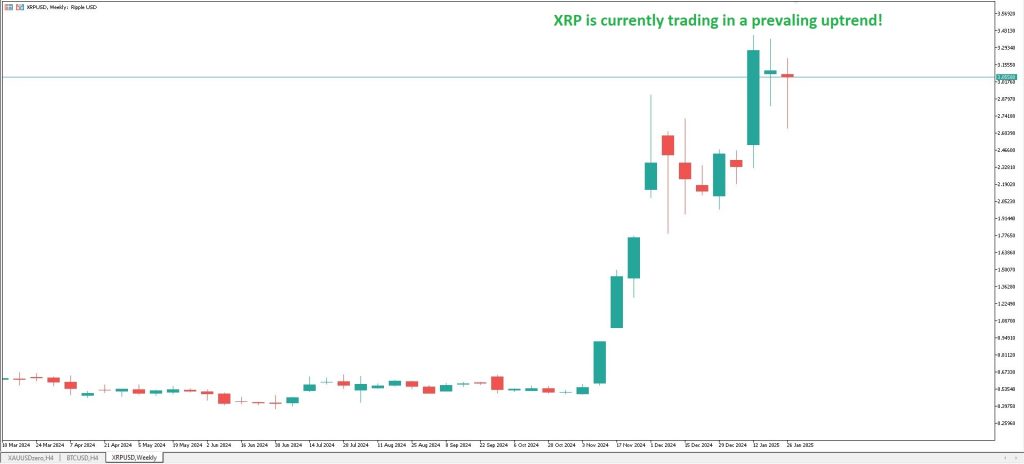
The first thing we look at on XRP is its prevailing trend.
According to its weekly chart, XRP had an interstellar breakout move in January 2025 past the long-trailing multi-monthly resistance of $0.75 in November 2024 that eventually led to a further break-out to create a new all-time-high breaking its former January 2018 record.
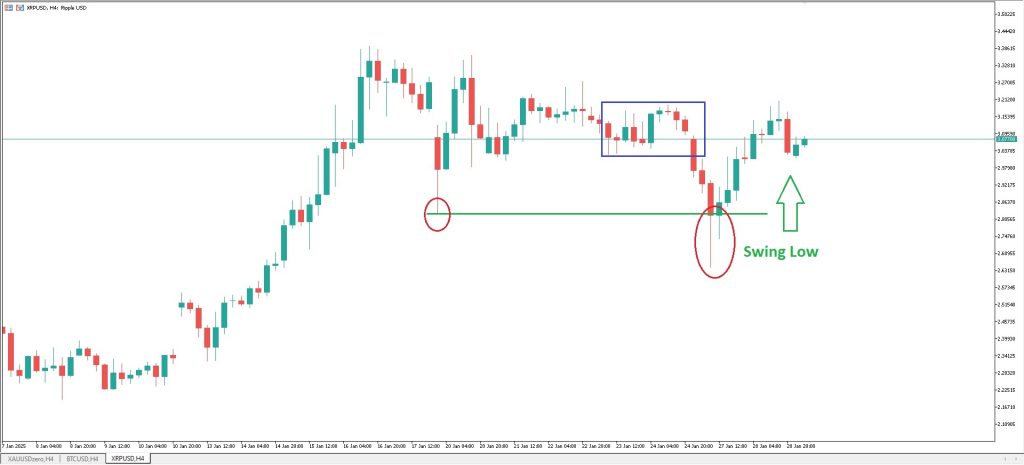
Now back to our topic’s context, zooming in on the 4H chart, XRP’s Monday drop towards the $2.64 area has made a perfect liquidity sweep on the trapped longs residing in the $3.03-3.20 range before the said drop.
Some traders opened short positions in the $2.80-$2.90 range, expecting a further breakdown.
However, they found themselves trapped as buyers stepped in near Monday’s lows. This buying pressure created a swing low area, leading to a mid-week price recovery.
Eventually, these short traders were forced to exit as their stop losses were triggered.
This caused some chain move reactions that reversed the trade direction back to the previously lost range and even retraced more strongly liquidating the short sellers’ positions this time creating its version of liquidity sweep for the buy sides.
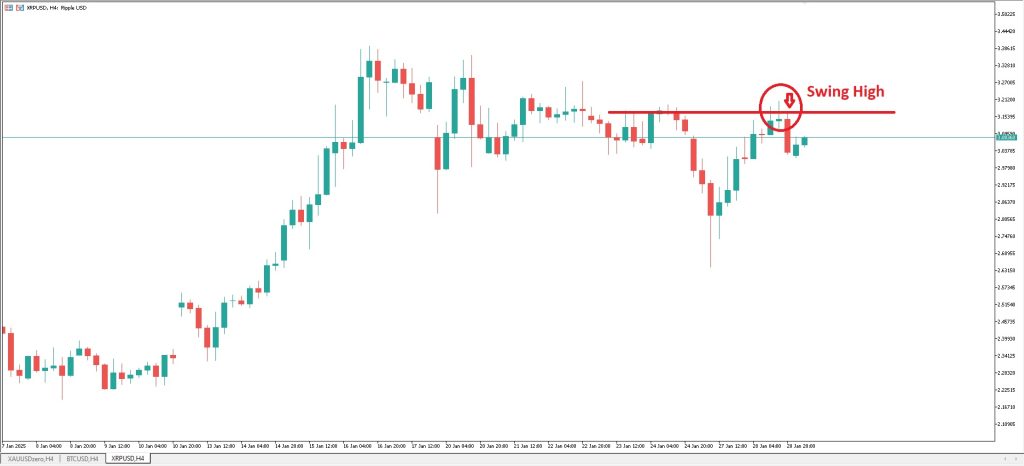
This example portrays 2 liquidity sweeps for both the buyers’ and sellers’ positions.
As mentioned earlier, liquidity runs are more favorable on trending assets. So, in XRP’s case, 3:1 RR long trade setups can be played out while 2:1 RR short trade setups can be worth a try after figuring out a possible re-test on support levels after a confirmed resistance level has occurred.
The chart below displays these respective setups.
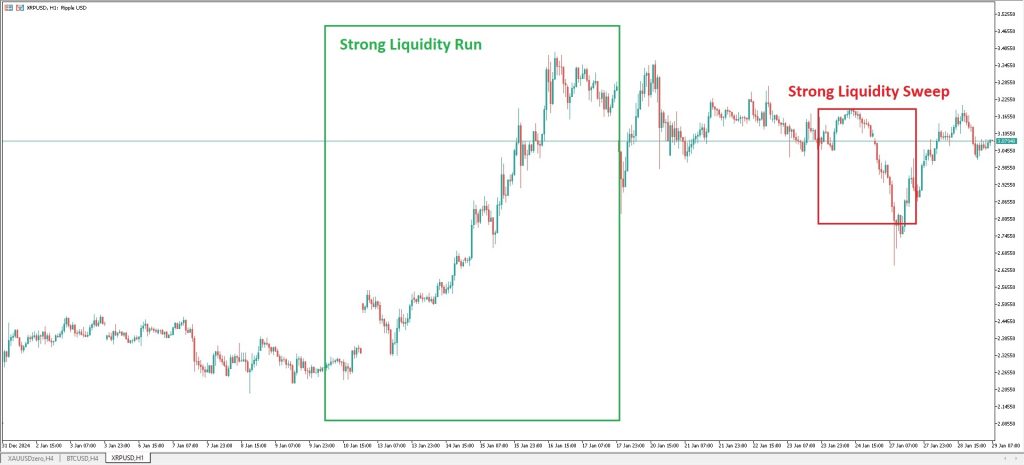
We just need to check the charts left and right as hints for the future liquidation points.
It is always either of the 2 sides of the traders which are buyers or sellers. Nothing in between.
There’s no such thing!
Final Thoughts
Liquidity sweeps and runs are powerful tools for understanding market behavior. By identifying these patterns, traders can anticipate potential reversals or trend continuations.
While these concepts require practice and patience, mastering them can elevate your trading strategy.
Remember, the market’s complexity demands continuous learning and disciplined risk management. Use these insights as part of your broader trading approach to unlock new opportunities.
Additionally, stay informed about market news and economic developments, as these factors often influence liquidity events.
Remember, this content is for educational purposes only and does not constitute financial advice.
Trading introduces potential risks, making appropriate risk management vital. Always trade prudently and seek advice from a financial advisor when necessary.
Are you a skilled and talented trader or a fund manager looking to join the ongoing leaderboard competition, and provide or copy trading signals?
(Disclaimer: This article is for informational and educational purposes only. It should not be considered financial advice. Always conduct your own research and consult with a qualified financial advisor before making any investment decisions.
For more detailed insights on developing daily trading routines, risk management, and effective position sizing strategies, explore additional articles on Trading Cup. Our trading experts at ACY and FinLogix are also great resources to guide your journey towards trading excellence.

Discover Our Best Trading Signals
At Tradingcup, you can browse through a selection of signals and review past performance before you decide to copy.
Become A Signal Provider
Share your expertise and become a signal provider so other traders can copy your trades.
Stay tuned to our blog for more trader spotlights and leaderboard updates.
Trading involves risks.
Visit the Tradingcup blog through the link below for more updates: https://www.tradingcup.com/learn
Related Copy Trading blogs:
- Understanding Market Liquidations: Liquidity Sweeps and Runs Explained
- 7 Essential Daily Habits of Successful Traders to Outperform Their Peers
- 10 Strategies You Can Copy off Our Best Copy Traders
- 5 Strategies Every Trader Can Master To Trade Better In A Trading Contest
- 2026 Copy Trading Scams Exposed: How to Spot Fraud
- A Swing Trading Strategy with an 83 Percent Win Rate and Low Drawdowns
- Forex Martingale Strategies Explained, The Good, The Bad and The Ugly
- Pyramiding Trading Tutorial – Pros & Cons & How to Use It