
How To Use Sharpe Ratio in Copy Trading: Evaluate Traders

TradingCup
MAY 27 2025
Last Updated: May 27, 2025
This article is reviewed annually to reflect the latest market regulations and trends.
TL;DR: Your Guide to Sharpe Ratio!
- Sharpe helps you gauge, if returns are worth the stage (of risk).
- High Sharpe’s the aim, for a steadier game.
- But don’t be a fool, it’s just one vital tool.
- Mix metrics with care, for a portfolio rare.
- With AI’s new sight, make your choices more bright!
Disclaimer: The information in this article is for educational purposes only and does not constitute financial, investment, or trading advice. Copy trading carries substantial risks, including the potential loss of your entire invested capital. Past performance of copied traders or strategies is not a reliable indicator of future results. You may be replicating high-risk trades, overleveraged positions, or strategies incompatible with your financial goals. Always conduct independent research into a trader’s historical performance, risk metrics, and strategy before copying them. Never invest funds you cannot afford to lose. Consult a licensed financial advisor to ensure copy trading aligns with your risk tolerance, financial objectives, and regulatory requirements in your jurisdiction. This article does not endorse specific traders, platforms, or strategies, and all trading decisions remain your sole responsibility.
“Wealth consists not in having great possessions, but in having few wants.” – Epictetus
Navigating the Copy Trading Maze: How the Sharpe Ratio Can Be Your Compass to Safer Havens
Copy trading. It sounds like a dream, doesn’t it? Hitching your wagon to a seasoned trader’s star and watching your investments grow. But how do you choose which star to follow? In a universe filled with dazzling claims of high returns, the Sharpe Ratio emerges as a crucial navigational tool, helping you look beyond the glitter and assess the journey’s actual risk. This guide will illuminate how to wield the Sharpe Ratio effectively, combine it with other critical metrics and even insights from investment legends like Warren Buffett, all to help you make smarter, more protected investment decisions in the copy trading world.
What is the Sharpe Ratio Anyway? (And Why Should You Care?)
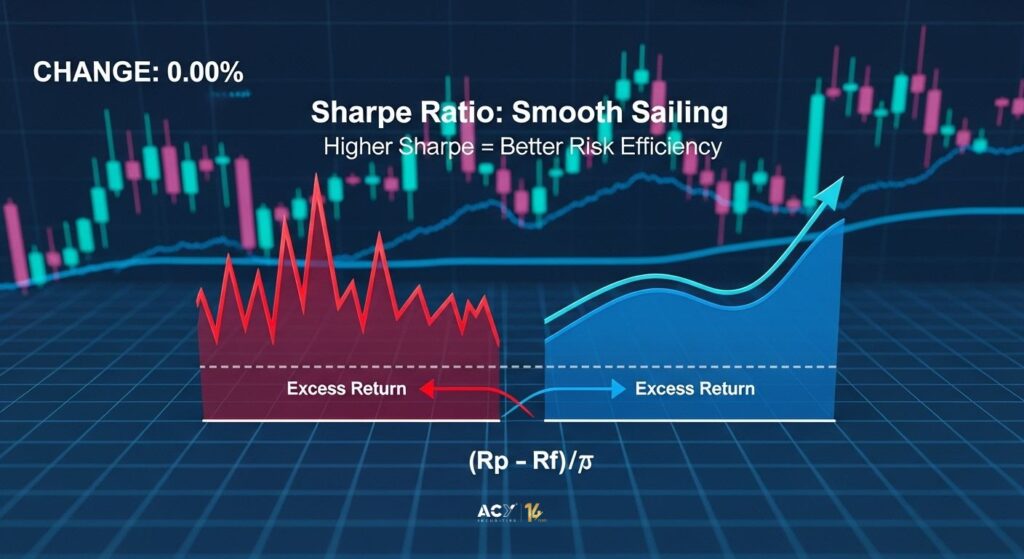
Imagine you’re choosing between two captains for a voyage. Captain A boasts of reaching distant, treasure-filled islands (high returns), but their ship has weathered many storms, some nearly catastrophic (high volatility). Captain B might talk of slightly less exotic isles (moderate returns), but their voyages are consistently smooth with nary a broken mast (low volatility). Which captain inspires more confidence for a long, prosperous journey?
The Sharpe Ratio, developed by Nobel laureate William F. Sharpe, is like a nautical chart that helps you make this kind of decision for your investments. It doesn’t just look at the treasure (returns); it quantifies how much risk (storminess) you have to endure to get that treasure. In essence, it measures your risk-adjusted return. A higher Sharpe Ratio suggests a better return for the amount of risk taken. This is paramount in copy trading, where you’re entrusting your capital to someone else’s strategy.
Beyond the Hype: Why ROI Alone Can Steer You Wrong in Copy Trading
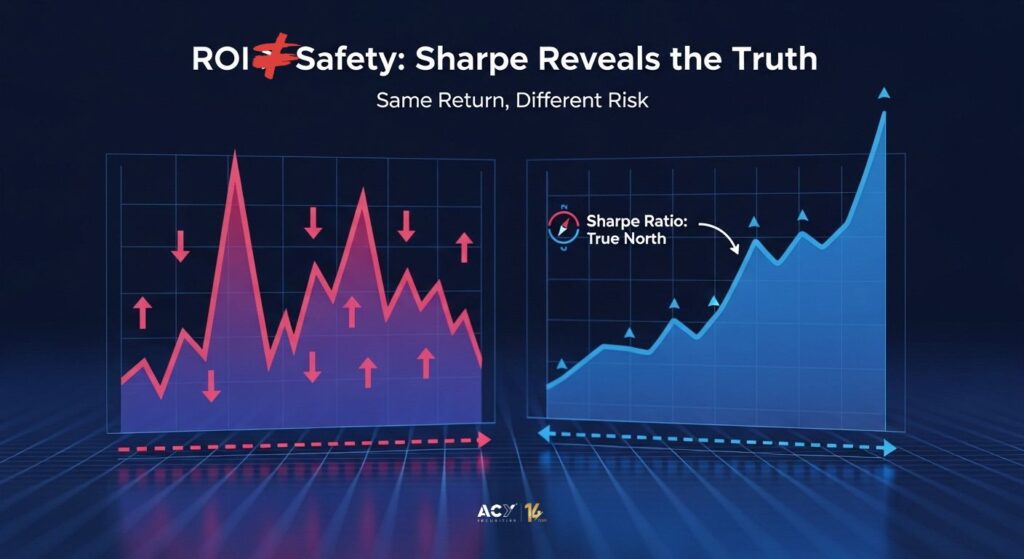
“Wow, Trader X made 150% ROI last year!” Impressive, right? Maybe. But what if, to achieve that, they took on colossal risks, their account value swinging wildly like a pendulum in a hurricane? What if they were one bad trade away from a total wipeout?
Return on Investment (ROI) is a simple, attractive number, but it tells only half the story. It’s the destination without describing the voyage. Two traders might achieve the same ROI, but one could have done it with steady, consistent gains, while the other experienced heart-stopping drops and euphoric spikes. The latter is a much riskier proposition, especially if you’re looking for sustainable growth and peace of mind. This is where the Sharpe Ratio steps in, offering a more nuanced view by factoring in the “how” – the volatility or risk involved in achieving those returns.
The Sharpe Ratio: Your Magnifying Glass for Comparing Copy Traders
In the bustling marketplace of copy trading platforms, the Sharpe Ratio acts as a crucial filter. It allows for a standardized comparison of traders, even if their strategies, traded instruments, or return figures differ wildly. Platforms often use it to rank traders because it reflects their ability to generate returns consistently while managing volatility. A trader with a consistently high Sharpe Ratio is generally deemed more reliable because they generate profits with less gut-wrenching variability, making them attractive candidates to copy.
How is the Sharpe Ratio Calculated?
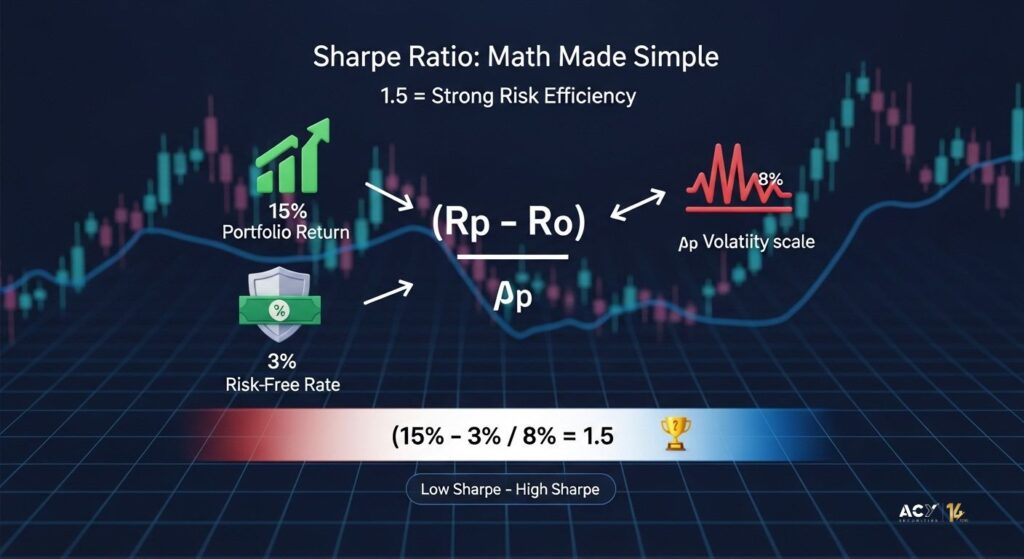
Don’t let the term “ratio” intimidate you. The calculation is straightforward:
Sharpe Ratio = (Rₚ – Rբ) / σₚ
Where:
- Rₚ (Portfolio Return): The average rate of return of the investment or trader you’re evaluating over a specific period (e.g., annual, monthly).
- Rբ (Risk-Free Rate): The return you could get from a theoretically “risk-free” investment over the same period. Think of government bonds or Treasury bills. This is your baseline – what you’d earn without taking on virtually any risk.
- σₚ (Standard Deviation of Portfolio’s Excess Return): This is the “storminess” factor – a measure of the investment’s volatility. It tells you how much the trader’s returns fluctuate around their average. A higher standard deviation means more erratic returns (bigger ups and downs).
Let’s walk through a simple example:
Suppose you’re evaluating “Trader Alpha”:
- Trader Alpha’s average annual return (Rₚ) = 15%
- Current annual risk-free rate (Rբ) = 3%
- Standard deviation of Trader Alpha’s returns (σₚ) = 8%
Sharpe Ratio for Trader Alpha: = (15% – 3%) / 8% = 12% / 8% = 1.5
This means Trader Alpha generated 1.5 units of return for every unit of risk taken, above the risk-free rate.
The Hypothetical example: Fund A with an annual return of 12%, a risk-free rate of 6%, and a standard deviation of 5% yields a Sharpe Ratio of (12% – 6%) / 5% = 1.20. Another example is a futures trading strategy with a monthly return of 4%, a risk-free rate of 0.33%, and a standard deviation of 2%, resulting in a Sharpe Ratio of (4% – 0.33%) / 2% = 1.835.
How is Volatility Measured in the Copy Trading Arena?
Volatility, represented by the standard deviation (σₚ) in the Sharpe Ratio formula, is the statistical measure of the dispersion of returns for a given trader or strategy. In simpler terms, it quantifies how much a trader’s returns swing up and down around their average return.
- Low Volatility: Implies that returns are relatively stable and predictable, clustering closely around the average. This often means smaller, more consistent gains.
- High Volatility: Implies that returns can fluctuate dramatically, with big wins and potentially big losses. The ride is bumpier.
In copy trading, understanding a trader’s volatility is crucial. High volatility isn’t inherently “bad” if it’s compensated by sufficiently high returns (leading to a good Sharpe Ratio). However, it can be psychologically taxing for copiers who aren’t prepared for large swings in their account value.
Putting Theory into Practice: Applying the Sharpe Ratio in Your Copy Trading Decisions
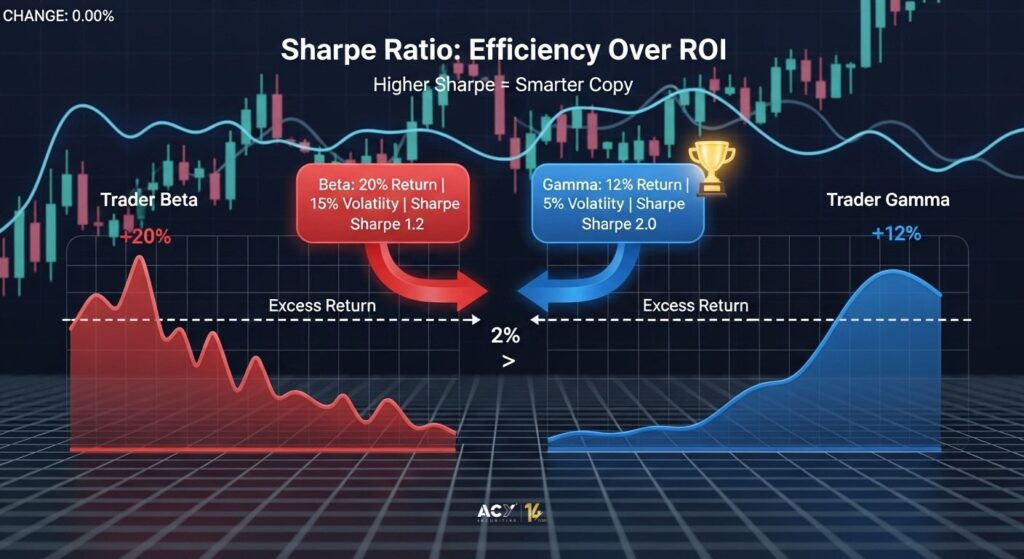
Let’s say you’re comparing two traders on a copy trading platform:
- Trader Beta:
- Average Annual Return (Rₚ): 20%
- Risk-Free Rate (Rբ): 2%
- Standard Deviation (σₚ): 15%
- Sharpe Ratio = (20% – 2%) / 15% = 1.2
- Average Annual Return (Rₚ): 20%
- Trader Gamma:
- Average Annual Return (Rₚ): 12%
- Risk-Free Rate (Rբ): 2%
- Standard Deviation (σₚ): 5%
- Sharpe Ratio = (12% – 2%) / 5% = 2.0
- Average Annual Return (Rₚ): 12%
Looking purely at ROI, Trader Beta (20%) seems more attractive than Trader Gamma (12%). However, Trader Gamma has a significantly higher Sharpe Ratio (2.0 vs. 1.2). This indicates Trader Gamma achieved their returns much more efficiently, with less volatility and therefore, arguably, less risk per unit of reward. For a risk-conscious copier, Trader Gamma might be the more prudent choice, even with a lower absolute return.
What’s the “Best” Sharpe Ratio for Copy Trading?
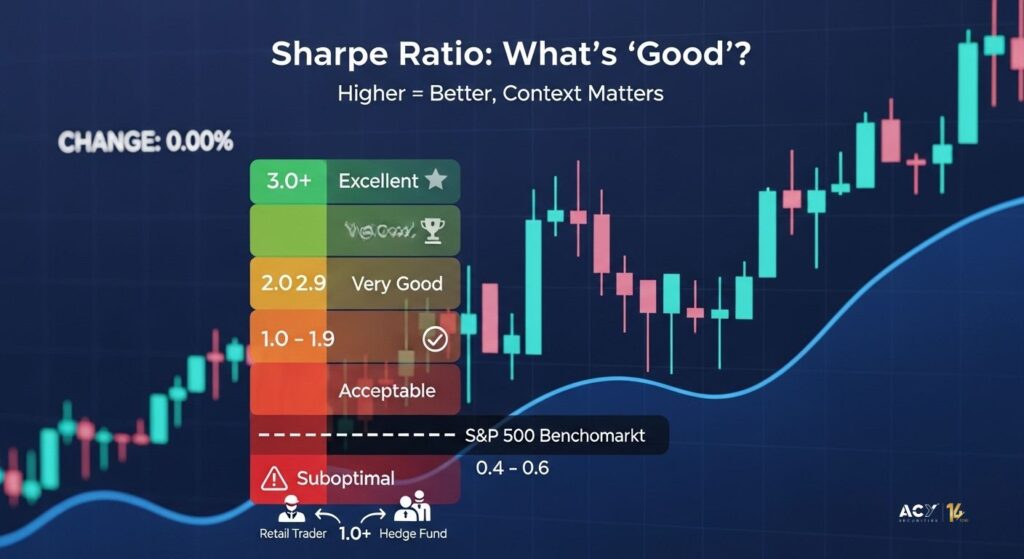
There’s no single magic number, as “good” can be subjective and context-dependent. However, here are some benchmarks and perspectives:
- General Benchmarks:
- Below 1: Often considered suboptimal. The returns may not justify the risk taken.
- 1.0 to 1.99: Considered acceptable to good. Retail algorithmic traders often find a Sharpe Ratio above 1 satisfactory.
- 2.0 to 2.99: Considered very good. Quantitative hedge funds typically require values exceeding 2.
- 3.0 or higher: Considered excellent, indicating strong performance relative to risk. This is often the realm of top-tier quantitative hedge funds.
S&P 500 Historical Sharpe Ratio: As a broad market benchmark, the S&P 500’s long-term historical Sharpe Ratio has typically been in the range of 0.4 to 0.6 (though this can vary significantly depending on the period analyzed). This means many professional traders aim to beat this benchmark consistently. If a copy trader has a Sharpe Ratio significantly and consistently above this, they might be adding real value.
- Below 1: Often considered suboptimal. The returns may not justify the risk taken.
What Would Warren Buffett Say About Sharpe Ratios in Copy Trading?

Warren Buffett, the Oracle of Omaha, doesn’t often frame his investment philosophy in terms of modern portfolio theory metrics like the Sharpe Ratio. His focus is on:
- Understanding the Business (or Trader’s Strategy): He invests in what he understands. In copy trading, this translates to understanding the trader’s methodology, not just their numbers. Long-Term Perspective: Buffett buys to hold for the long haul. Short-term volatility (a key Sharpe component) is less of a concern if the long-term value proposition is sound. Margin of Safety: Buying assets at a significant discount to their intrinsic value. This could mean favoring traders with a proven, consistent edge and robust risk management that protects capital for copy trading.R isk as Permanent Loss of Capital: For Buffett, risk isn’t just volatility; it’s the chance of permanently losing your money. A trader might have a decent Sharpe Ratio over a period but could employ a strategy that courts catastrophic loss (e.g., selling uncovered options). Buffett would likely find this unacceptable.
Warren Buffett’s (Berkshire Hathaway) Sharpe Ratio: Calculating a precise Sharpe Ratio for Berkshire Hathaway is complex due to its evolving nature (from textile company to conglomerate). However, studies analyzing its performance often show a Sharpe Ratio significantly above the S&P 500, typically in the 0.6 to 0.8+ range over very long periods, which is exceptional for such a large and diversified entity. This reflects excellent risk-adjusted returns over decades. A copy trader consistently achieving such a ratio would be remarkable. However, directly comparing a globally diversified, long-term holding company to a potentially shorter-term, more focused copy trading strategy requires nuance. The takeaway is the consistency of delivering superior risk-adjusted returns.
Smarter Investing Inspired by “Quality Investing”: 10 Lessons for Your Copy Trading Journey
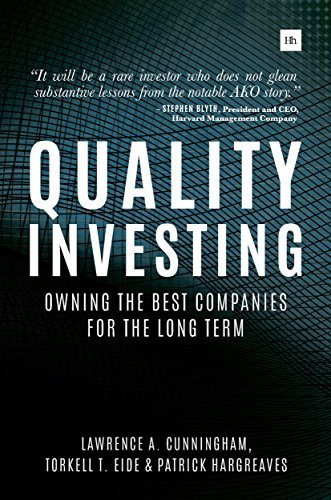
Lawrence Cunningham’s “Quality Investing” focuses on identifying high-quality companies. We can adapt these principles to select high-quality traders in copy trading:
- Seek a Sustainable “Edge” (Economic Moat): Does the trader have a clear, understandable strategy that’s likely to remain effective? Avoid black boxes.
- Look for Consistent Profitability (Strong Financials): Are profits steady over time, or erratic? Check metrics like win rate, profit factor, alongside Sharpe.
- Prioritize Capital Preservation (Margin of Safety): Does the trader have robust risk management? Low MDD and good risk/reward ratios per trade are key.
- Evaluate the “Management” (Trader Discipline & Transparency): Is the trader disciplined in following their strategy? Are they transparent about their methods and performance?
- Focus on Long-Term Performance (Compounding Power): Don’t be swayed by short-term hot streaks. Look for years, not months, of good performance.
- Avoid “Story” Stocks (Overhyped Traders): Be wary of traders with huge followings but little substance or a very short, lucky track record.
- Understand How They Generate Returns (Business Model): Is it through scalping, swing trading, trend following? Does their style suit your risk appetite?
- Be Wary of Excessive “Leverage” (Risk): High leverage can amplify gains but also losses. Ensure the trader’s leverage use is sensible.
- Demand “Honest Accounting” (Verified Track Record): Stick to platforms that provide verified, transparent trading histories.
- Patience is a Virtue (Long-Term Holding): If you’ve found a quality trader, give their strategy time to work. Don’t jump ship at the first dip if the fundamentals remain sound.
Using the Sharpe Ratio Filter (e.g., on TradingCup)
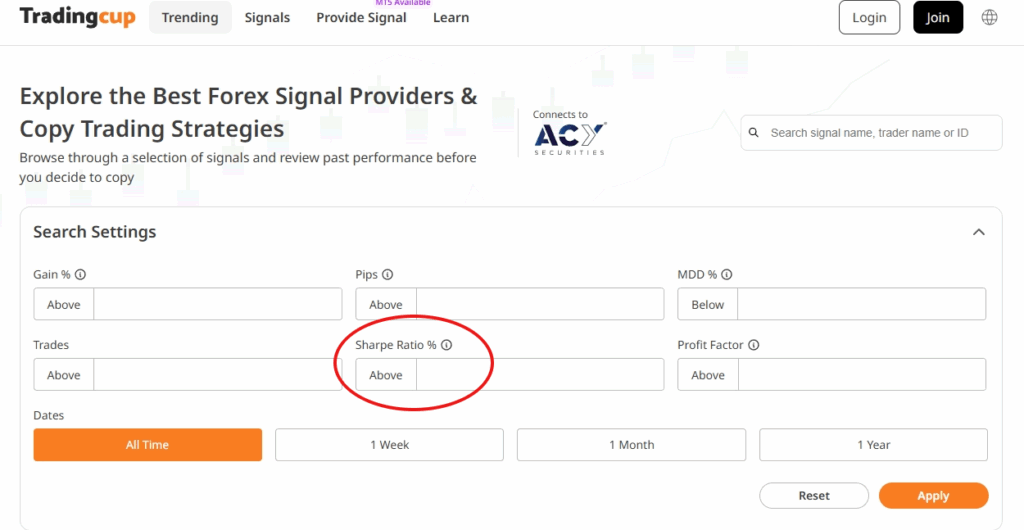
Many copy trading platforms, like TradingCup, provide filters to help you sift through traders. A Sharpe Ratio filter is invaluable. When using it:
- Set a Minimum Threshold: Based on the benchmarks above, you might start by filtering for traders with a Sharpe Ratio of 1.0 or higher.
- Consider the Timeframe: A high Sharpe Ratio over one month is less meaningful than a good Sharpe Ratio sustained over a year or more. Look for consistency.
- Don’t Use it in Isolation: A high Sharpe Ratio is a great starting point, but it’s not the whole picture. Combine it with other filters and qualitative analysis.
The Art of Selection: How to Pick Copy Traders Using the Sharpe Ratio (Wisely!)
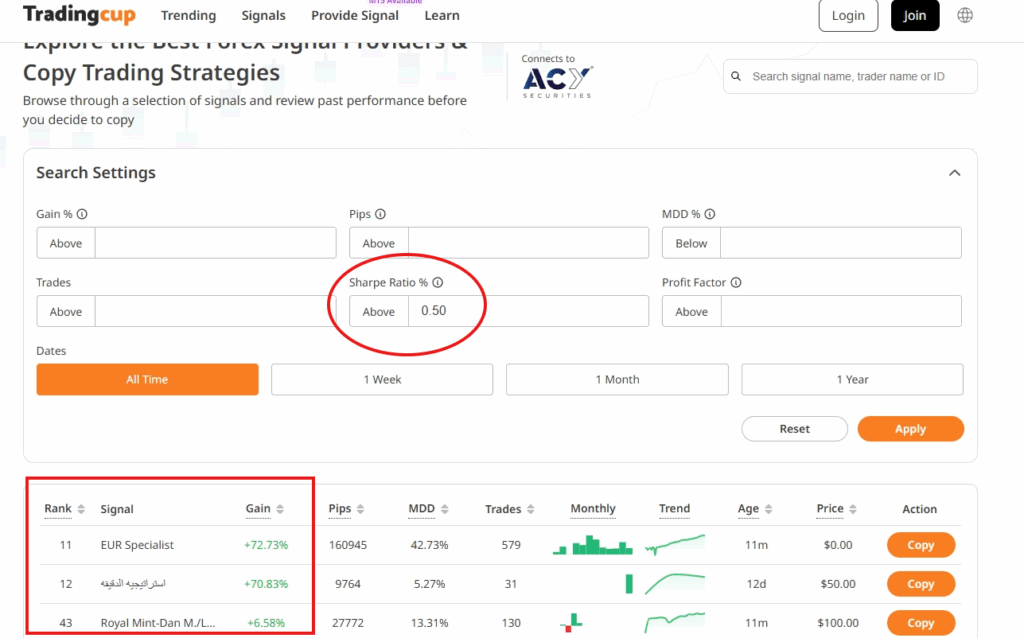
Using the Sharpe Ratio effectively isn’t just about finding the highest number. It’s about intelligent selection:
- Start with a Decent Sharpe Ratio: As discussed, use it as an initial filter.
- Look at the Components: Is a high Sharpe Ratio due to exceptionally high returns or remarkably low volatility? Or a good balance? Understanding this gives more insight.
- Check the Track Record Length: A trader with a Sharpe of 2.0 over 3 years is generally more reliable than one with a Sharpe of 2.5 over 3 months.
- Consistency is Key: Is the Sharpe Ratio stable, or does it fluctuate wildly? Check the performance history.
- Compare Apples to Apples (Mostly): While Sharpe Ratio helps standardize, be mindful if comparing traders with vastly different strategies (e.g., a low-volatility bond trader vs. a high-growth crypto trader). Their “good” Sharpe Ratios might sit in different ranges.
The Limitations: When the Sharpe Ratio Paints an Incomplete Picture
While powerful, the Sharpe Ratio isn’t a crystal ball. It has limitations:
- Assumes Normal Distribution: It works best when returns are “normally distributed” (a bell curve). Many trading strategies, especially those with occasional large wins or losses, have “asymmetric” or “fat-tailed” distributions, where the Sharpe Ratio can be misleading.
- Treats All Volatility as Equal: It penalizes upside volatility (big unexpected gains) the same as downside volatility (big unexpected losses). Most investors are primarily concerned with the latter.
- Backward-Looking: It’s based purely on historical data and doesn’t guarantee future performance. A trader’s strategy might become less effective in changing market conditions.
- Doesn’t Capture Tail Risk: Strategies that seem stable (and have a good Sharpe Ratio) might be susceptible to rare, extreme events (tail risks) that aren’t adequately reflected in standard deviation.
- Path Dependency Ignored: Two traders could have the same Sharpe Ratio, but one might have achieved it with smooth returns, while the other had massive drawdowns before recovering. The emotional toll and risk of ruin are very different.
- Susceptible to Manipulation (Short-Term): A trader could, for a short period, reduce volatility (and thus boost their Sharpe Ratio) by taking on less visible risks, or by simply having a lucky streak with small, consistent wins.
- Transaction Costs Often Excluded: The basic Sharpe Ratio calculation might not factor in trading costs, fees, or slippage, which can eat into actual returns.
Beyond Sharpe: Essential Metrics for a 360-Degree View
Given its limitations, you should always use the Sharpe Ratio as part of a broader toolkit. Here are some crucial companions:
- Sortino Ratio: Focusing on the Bad Volatility The Sortino Ratio is a modification of the Sharpe Ratio that only considers downside deviation (harmful volatility) below a specified target return, rather than total volatility. It doesn’t penalize for upside swings, which many investors welcome. This makes it particularly useful for strategies with asymmetric return profiles, like trend-following systems.
- Example: A portfolio with an expected annual return of 12%, a target return of 4%, and a downside deviation of 5% yields a Sortino Ratio of 1.6.
- Example: A portfolio with an expected annual return of 12%, a target return of 4%, and a downside deviation of 5% yields a Sortino Ratio of 1.6.
- Maximum Drawdown (MDD): Understanding the Worst-Case Scenario MDD measures the largest peak-to-trough percentage decline in an investment’s value before a new peak is achieved. It shows you the most an investment has lost from its highest point. This is critical for understanding potential worst-case scenarios and your own risk tolerance.
- Example: If a portfolio grows to $100,000, drops to $75,000, and then recovers, the MDD is 25%.
- Example: If a portfolio grows to $100,000, drops to $75,000, and then recovers, the MDD is 25%.
- Calmar Ratio: Resilience After the Storm The Calmar Ratio (or MAR Ratio) relates the annualized return to the maximum drawdown. A higher Calmar Ratio suggests better performance relative to the largest experienced loss, emphasizing recovery and resilience. It’s particularly useful for evaluating strategies over longer timeframes.
- Example: A hedge fund generating a 15% annualized return with a 25% MDD yields a Calmar Ratio of 0.6 (15%/25%).
Combining Traders with Good Sharpe Ratios for a Smarter Portfolio
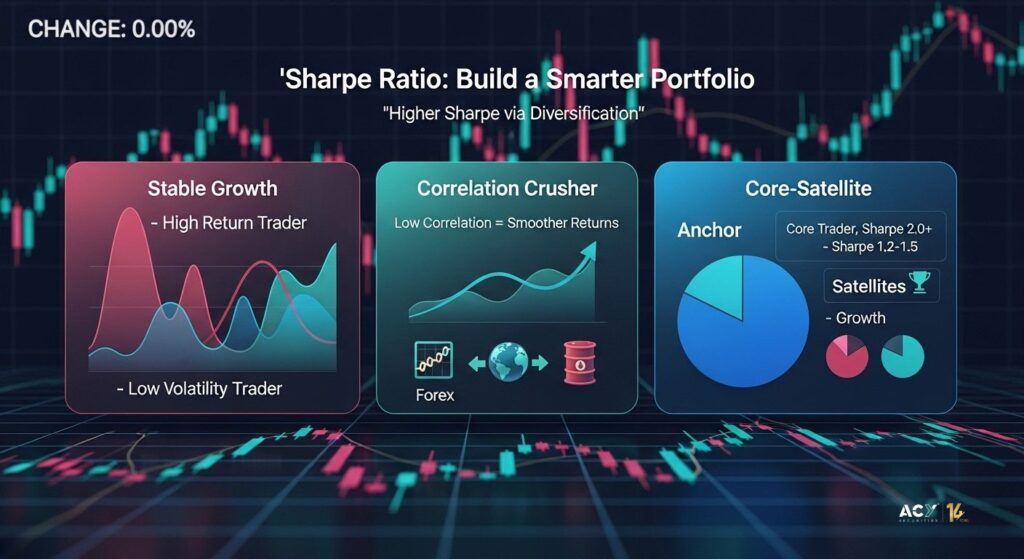
Diversifying across multiple traders can improve your portfolio’s overall risk-adjusted return. Here are a few strategies for combining traders, keeping their Sharpe Ratios in mind:
Strategy 1: The “Stable Growth” Combo (High Return + Stable Return)
Concept: Pair a trader who delivers high returns (even if with moderate volatility, but still a good Sharpe) with another trader who offers more stable, albeit potentially lower, returns (and a very good Sharpe due to low volatility).
Goal: Achieve a blended portfolio that offers strong growth potential while smoothing out the overall volatility. The aim is a combined portfolio with a less risky profile than just chasing the highest return trader.
Strategy 2: The “Correlation Crusher” Combo (Diversification Focus)
Concept: Select traders whose strategies have low correlation with each other. This means their winning and losing periods don’t typically overlap. One might trade Forex majors, another emerging market equities, and a third commodities.
Goal: Even if individual Sharpe Ratios are just “good,” if their strategies are genuinely uncorrelated, the combined portfolio can achieve a superior Sharpe Ratio and lower overall risk. This is because when one strategy zigs, the other zags, smoothing out returns.
Strategy 3: The “Core-Satellite” Approach (Balanced Risk)
Concept: Allocate the majority of your copy trading capital (the “core”) to one or two traders with proven, high, and stable Sharpe Ratios and low MDD. Then, allocate smaller portions of capital (the “satellites”) to traders who might have potentially higher returns but also higher risk (perhaps newer traders with promising but shorter track records, or those in more volatile markets).
Goal: Anchor your portfolio with consistent performers while allowing for a bit more aggressive growth potential from the satellite allocations, without exposing your entire capital to excessive risk.
Don’t Forget the Fine Print: Factoring in Costs!
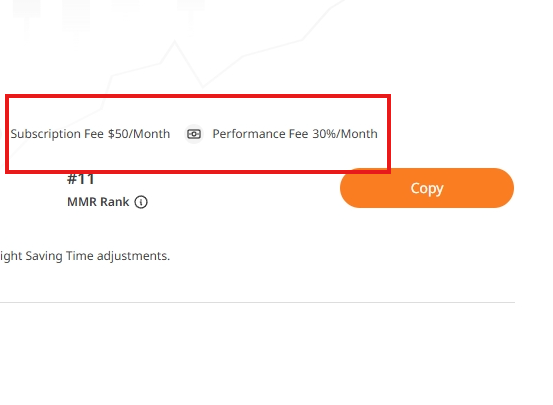
A trader’s raw performance (and thus their calculated Sharpe Ratio) can look great, but you need to consider the costs you’ll incur as a copier. These can significantly impact your net returns:
- Subscription Fees: Some platforms or traders charge a flat monthly or annual fee.
- Performance Fees (Profit Sharing): Many traders take a percentage of the profits they generate for you (e.g., 20-30%).
- Spreads & Commissions: The underlying broker’s trading costs.
- Slippage: The difference between the expected price of a trade and the price at which the trade is actually executed.
Always calculate or estimate what your net Sharpe Ratio would be after these costs. A stellar gross Sharpe Ratio can become mediocre if fees are too high.
How Artificial Intelligence is Revolutionizing Sharpe Ratio Analysis in Copy Trading
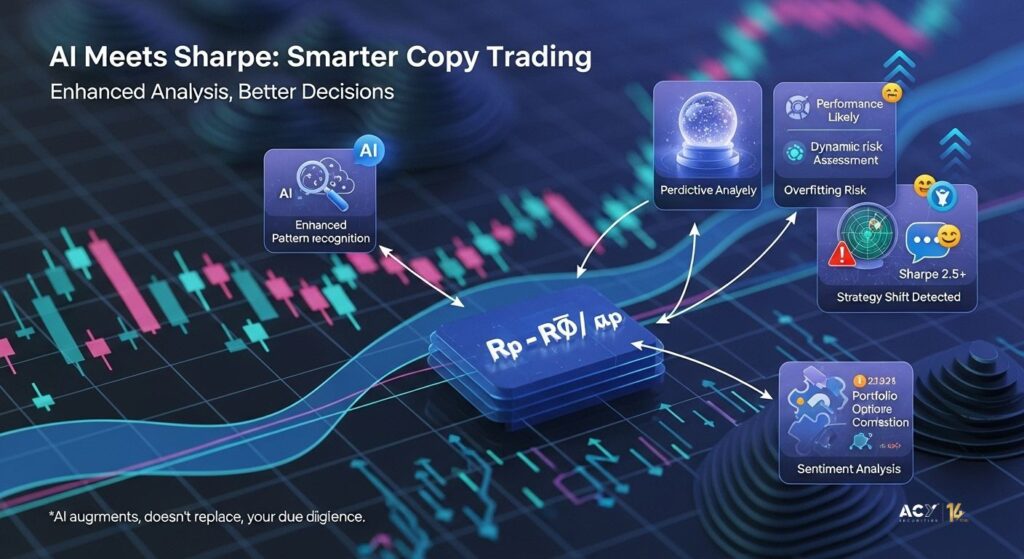
Artificial Intelligence (AI) is increasingly being integrated into copy trading platforms, offering more sophisticated ways to evaluate traders beyond traditional metrics:
- Enhanced Pattern Recognition: AI can analyze vast amounts of a trader’s historical data (trades, market conditions, even behavioral patterns) to identify subtle indicators of future performance or hidden risks that a simple Sharpe Ratio calculation might miss.
- Predictive Analytics: Machine learning models can forecast the likelihood of a trader maintaining their performance or flag strategies prone to overfitting or significant tail risks.
- Dynamic Risk Assessment: AI can monitor trading activity in real-time, detecting anomalies or shifts in a trader’s strategy that could alter their risk profile.
- Portfolio Optimization: AI tools can help construct optimized portfolios of copied traders by considering complex correlations and risk-return trade-offs.
- Sentiment Analysis: Some AI systems can analyze news and social media sentiment related to assets a trader focuses on, providing another layer of insight.
While AI offers powerful enhancements, it’s a tool to augment, not replace, your own due diligence. The core principles of understanding risk and return remain vital
Your Ultimate Sharpe Ratio Checklist for Copy Trading Success
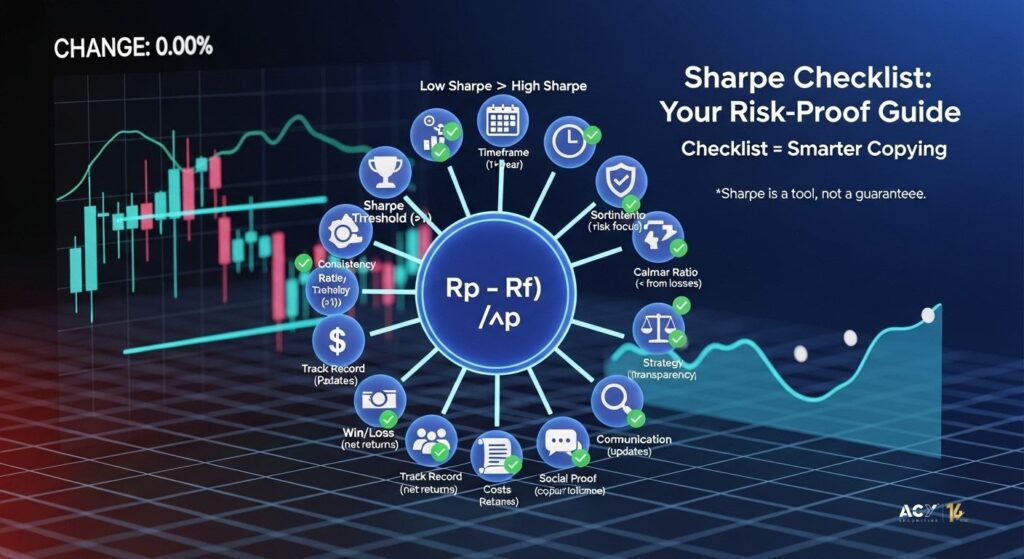
Before you copy a trader, run through this checklist:
[ ] What is the Trader’s Sharpe Ratio? (Aim for >1, ideally higher).
[ ] Over What Period was it Calculated? (Longer is better, min 1 year if possible).
[ ] How Consistent is the Sharpe Ratio? (Check quarterly/annual figures if available).
[ ] What is their Maximum Drawdown (MDD)? (Is this acceptable to you?).
[ ] What is their Sortino Ratio? (Does it confirm good downside risk management?).
[ ] What is their Calmar Ratio? (How well do they recover from losses?).
[ ] What is the Trader’s Strategy? (Do you understand it? Is it transparent?).
[ ] What is their Average Win/Loss Ratio & Profit Factor?
[ ] How Long is their Track Record? (Verified history).
[ ] What are the Associated Costs? (Subscription, performance fees – recalculate your net potential).
[ ] How Many People are Copying Them & with How Much Capital? (Social proof, but not a sole indicator).
[ ] Does the Trader Communicate with Copiers? (Transparency, updates).
[ ] Does their Risk Profile Align with YOUR Risk Tolerance? (Crucial!).
The Sharpe Ratio – A Vital Tool, Not a Silver Bullet, for Protecting Your Capital
The Sharpe Ratio is an indispensable metric in the copy trading world. It elevates your decision-making beyond simplistic ROI chasing and forces a crucial consideration of risk. By understanding its calculation, applications, and importantly, its limitations, you can use it to identify traders who are not just profitable, but who achieve those profits prudently.
However, never rely on the Sharpe Ratio in isolation. Combine it with other metrics like the Sortino Ratio, Maximum Drawdown, and Calmar Ratio, conduct qualitative research into the trader’s strategy and discipline, and always be mindful of costs. As AI continues to evolve, it will offer even more sophisticated tools for evaluation, but the foundational principle remains: invest wisely, protect your capital, and understand the risks you’re undertaking. The journey to successful copy trading is a marathon, not a sprint, and the Sharpe Ratio is one of your most reliable pacing tools.
Frequently Asked Questions (FAQs)
Q1: What is the Sharpe Ratio in simple terms?
The Sharpe Ratio measures an investment’s performance compared to a risk-free asset, after adjusting for its risk (volatility). A higher Sharpe Ratio generally indicates better performance for the amount of risk taken.
Q2: Is a higher Sharpe Ratio always better in copy trading?
Generally, yes, a higher Sharpe Ratio suggests better risk-adjusted returns. However, it’s crucial to look at the consistency of the Sharpe Ratio over time and consider it alongside other metrics like Maximum Drawdown, as a very high short-term Sharpe Ratio can sometimes be misleading.
Q3: What is considered a “good” Sharpe Ratio for a copy trader?
A Sharpe Ratio above 1 is often considered acceptable, above 2 is very good, and above 3 is excellent. However, this can vary based on the strategy and market conditions. Compare it to benchmarks like the S&P 500’s historical Sharpe Ratio (often below 1).
Q4: How does the Sharpe Ratio help in comparing different traders?
It provides a standardized measure to compare traders by looking at their returns in relation to the risk they took. This helps identify traders who are more efficient at generating returns per unit of risk.
Q5: What are the main limitations of using the Sharpe Ratio for trader selection?
Key limitations include its assumption of normally distributed returns (which isn’t always true in finance), its equal penalization of upside and downside volatility, its backward-looking nature, and its potential failure to capture tail risks or account for transaction costs if not explicitly included.
Q6: Why is ROI not the only metric I need for choosing a copy trader?
ROI only shows the return, not the risk taken to achieve it. A trader might have a high ROI but also dangerously high volatility and large drawdowns, making them a risky choice. The Sharpe Ratio provides a more balanced view.
Q7: How can AI improve the use of Sharpe Ratio in copy trading?
AI can analyze trader performance more deeply, identify patterns, predict potential risks or strategy decay, and help optimize portfolios of copied traders by considering factors beyond what traditional Sharpe Ratio analysis can offer.
Q8: Should I consider fees when looking at a trader’s Sharpe Ratio?
Absolutely. The Sharpe Ratio displayed by a platform is usually based on the trader’s gross performance. You need to account for subscription fees, performance fees, and other costs, as these will reduce your net returns and your effective Sharpe Ratio.
Q9: What is “volatility” in copy trading and how does Sharpe Ratio use it?
Volatility, typically measured by standard deviation, reflects how much a trader’s returns fluctuate around their average. The Sharpe Ratio uses this standard deviation in its denominator to assess if returns are high enough to justify this fluctuation.
Q10: Can a trader have a good Sharpe Ratio but still be risky?
Yes. For example, a strategy might have low volatility and consistent small gains (leading to a good Sharpe Ratio) but be exposed to rare, catastrophic losses (tail risk) that aren’t well captured by standard deviation. This is why looking at MDD and other metrics is crucial.
(Disclaimer: This article is for informational and educational purposes only. It should not be considered financial advice. Always conduct your own research and consult with a qualified financial advisor before making any investment decisions.)
For more detailed insights on developing daily trading routines, risk management, and effective position sizing strategies, explore additional articles on Trading Cup. Our trading experts at ACY and FinLogix are also great resources to guide your journey towards trading excellence.

Discover Our Best Trading Signals
At Tradingcup, you can browse through a selection of signals and review past performance before you decide to copy.
Become A Signal Provider
Share your expertise and become a signal provider so other traders can copy your trades.
Stay tuned to our blog for more trader spotlights and leaderboard updates.
Trading involves risks.
Visit the Tradingcup blog through the link below for more updates: https://www.tradingcup.com/learn
Related Copy Trading blogs:
- Understanding Market Liquidations: Liquidity Sweeps and Runs Explained
- 7 Essential Daily Habits of Successful Traders to Outperform Their Peers
- 10 Strategies You Can Copy off Our Best Copy Traders
- 5 Strategies Every Trader Can Master To Trade Better In A Trading Contest
- 2025 Copy Trading Scams Exposed: How to Spot Fraud
- A Swing Trading Strategy with an 83 Percent Win Rate and Low Drawdowns
- Forex Martingale Strategies Explained, The Good, The Bad and The Ugly
- Pyramiding Trading Tutorial – Pros & Cons & How to Use It